
Mobile gaming enters 2027 with a large audience, established spending habits and difficult competition for attention. For a publisher, the useful market report connects those conditions with decisions about genre, geography, acquisition and monetization. A large global revenue figure alone cannot tell a studio whether its next game will recover its development or marketing cost.
The evidence available before 2027 points toward a market where retaining and monetizing players deserves close attention. This outlook uses historical observations and explicitly labeled forecasts from primary research sources. A report named “2026” often describes activity during 2025. Those periods stay attached to the figures below.
The central planning task is to connect market evidence with your own game economics. Use research to identify a question worth testing, then use product and cohort data to decide whether the opportunity applies to your audience.
Where the mobile gaming market stands before 2027
Newzoo’s June 2026 assessment put 2025 mobile game revenue at $113.3 billion, within a global games market of $201.6 billion. Its later August 2026 forecast estimated mobile revenue of $121.1 billion for 2026. The latter is a forecast for 2026, with mobile remaining the largest platform in that model.
Sensor Tower’s State of Gaming 2026 announcement reported approximately $82 billion in mobile game IAP revenue for 2025, up 1%. It also identified strategy as the only genre in its analysis to grow across revenue, downloads and time spent. Last War: Survival and Whiteout Survival led its 2025 revenue ranking.
These observations support an emphasis on retention and monetization, but the revenue figures use different scopes. They do not establish that one source is wrong or that the difference between them represents advertising revenue. The first useful step in reading any market report is understanding what it measures.
Read the revenue definition before using the headline
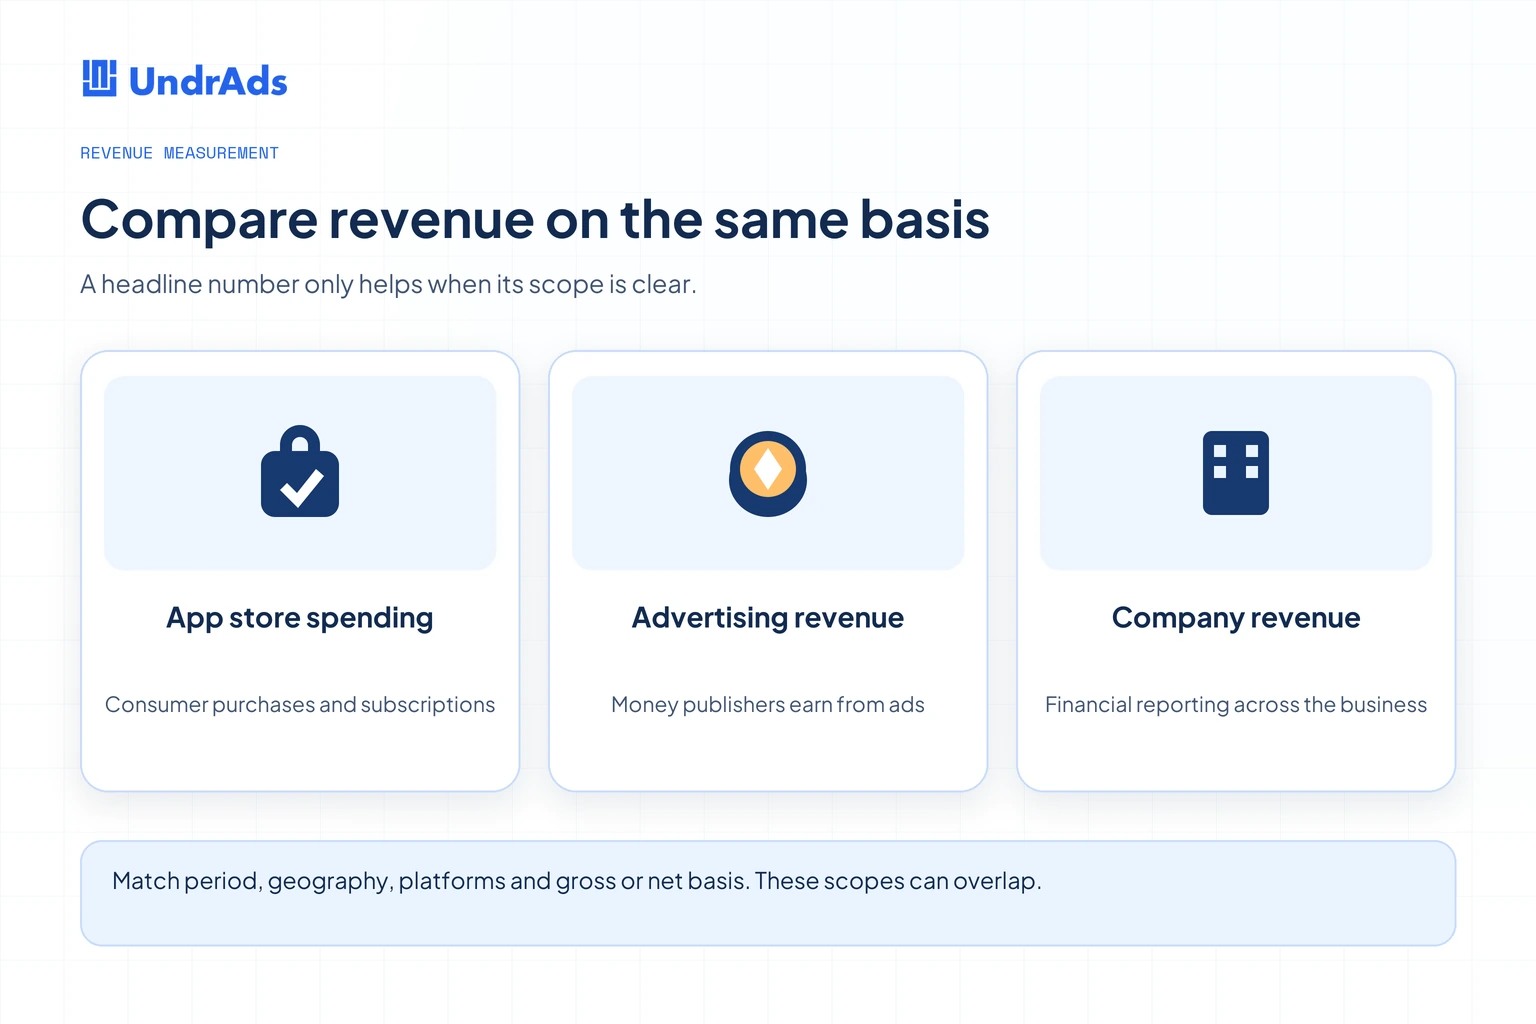
Newzoo’s methodology explanation describes consumer spending on games and excludes advertising revenue. Its mobile scope includes paid downloads and in-game spending across stores, including third-party stores and direct downloads. A narrower app-store IAP estimate will therefore answer a different question.
Publisher advertising revenue, consumer purchases, advertiser spending and company financial revenue belong in separately labeled columns. Some overlap; others describe different sides of the same transaction. Adding them together without a consistent methodology can double count activity or mix gross spending with money received by a business.
| Evidence | Period | Figure or scope | How to use it |
|---|---|---|---|
| Newzoo mobile assessment | 2025 | $113.3B mobile consumer revenue | Historical market scale within Newzoo’s definitions |
| Newzoo mobile forecast | 2026 forecast | $121.1B | Forward estimate, subject to revision |
| Sensor Tower State of Gaming | 2025, published in 2026 | About $82B mobile IAP revenue | Store-based spending context and genre analysis |
| Adjust Gaming App Insights | 2026 report edition | Acquisition, engagement and cost benchmarks | Operational comparisons after checking the sample and period |
For your own planning sheet, keep the source URL, publication date, measurement period, geography, platform coverage and gross or net treatment beside every number. Add an “observed or forecast” field. These small details make the sheet usable when the next report revises a headline or another team wants to compare it with a different source.
Do the same with internal data. Finance may report finalized revenue while a mediation dashboard shows estimates. A UA export may use an attribution window that differs from product analytics. Reconcile those definitions before using market growth to explain a change in the game’s performance.
What a 2027 outlook can reasonably tell publishers
There is no full-year observed 2027 market result before the year starts. Treat the year in this guide as the planning horizon. Use the latest available historical data to build scenarios, then update the assumptions as new evidence arrives.
A useful scenario model includes retention, payer conversion, ad engagement and acquisition cost. Change one assumption at a time to see which has the largest effect on payback. This reveals whether the studio needs a stronger early game, a better monetization design or a different distribution plan.
Keep a base case that the team can explain. An upside case should state what must improve, and a downside case should show which spending or release decisions change if performance falls short. Avoid assigning a precise industry growth rate to your own title without explaining the mechanism that connects them.
Genre performance: five different operating models
Hypercasual: ad economics depend on the full session
Hypercasual design often starts with a quickly understood mechanic and low friction. For an ad-led implementation, the practical model connects sessions, eligible placements, delivered impressions and revenue per impression. Download volume alone leaves out most of that chain.
Test onboarding and the first ad separately. A game can acquire inexpensive users while losing too many before they reach a useful monetization moment. Review device performance, loading time and the number of actions before the mechanic becomes clear.
There is no universal number of ads per session that makes the model profitable. Use retention, session abandonment and total revenue per user to test frequency. A profitable placement in one title can be unsuitable in another with a shorter or more concentration-heavy loop.
Casual: progression and repeat play shape the model
Casual games can combine purchases, ads and event systems in several ways. Study what the player wants at a particular moment: another attempt, a booster, collection progress or access to more content. The commercial design follows that motivation.
Compare monetization changes within meaningful player groups. A new player learning the mechanic and a returning player near the end of an event have different needs. Use observed behavior to define the experiment rather than assuming every user should see the same offer.
Content cadence is also a cost. A game that earns through continued progression needs a realistic plan for producing and testing that progression. Include art, level design, localization and support in the operating model alongside marketing and ad revenue.
Hybrid casual: added depth must earn its production cost
Hybrid casual usually describes accessible core play combined with deeper progression and a mix of monetization methods. The label covers many different games, so a genre average should be used cautiously when estimating the economics of a specific project.
Evaluate each added layer against a product hypothesis. A collection, upgrade system or event should give the player a reason to return that fits the core mechanic. More screens and currencies can also create confusion, which makes onboarding and progression testing necessary.
Budget development in stages. Build enough of the meta layer to test whether players understand and value it before committing to a large live-operations calendar. Measure retention, purchases and ad engagement together. A deeper game costs more to maintain, so revenue growth needs to cover that work.
Strategy: long-term behavior matters
Sensor Tower’s 2025 findings make strategy worth studying, but a successful title’s results do not remove the category’s operating demands. A studio evaluating strategy should model alliance systems, progression balance, content and player support over a longer relationship with the user.
Separate first-purchase conversion from later spending and retention. Early revenue can look encouraging while the social or competitive structure fails to hold users. Use cohort windows that reflect the game’s actual progression rather than judging the whole model after the tutorial.
Plan support and economy review as part of production. Competitive events and valuable purchases require clear explanations and reliable delivery. Keep offer behavior and reward records traceable so the team can investigate a problem without relying on a player’s memory.
RPG: collection and progression need clear value
RPG implementations can monetize content, characters, cosmetics, passes and progression in different combinations. Assess the design your team can operate responsibly and explain clearly. A genre label does not establish the right purchase structure or price.
When randomized rewards are involved, review the relevant platform rules and local requirements with the responsible specialists. Keep odds, eligibility and purchase information consistent with the live implementation. A market report is insufficient guidance for those decisions.
Test whether nonpaying users can understand the progression and remain engaged. Then evaluate which paid benefits appeal to users who choose to spend. That gives the studio a product-specific basis for its model instead of importing another game’s assumed revenue per user.
| Genre | Revenue model to evaluate | Important product question | Cost to include |
|---|---|---|---|
| Hypercasual | Often ad led | Do users reach and return from monetization moments? | Acquisition, iteration and SDK maintenance |
| Casual | Purchases, ads or a mix | Which benefits fit the player’s current goal? | Levels, events and creative production |
| Hybrid casual | Ads plus progression-related spending | Does the added layer improve lifetime economics? | Meta systems and live operations |
| Strategy | Often purchase centered | Does the social and competitive loop retain players? | Long-term content, economy and support |
| RPG | Collection, content and progression spending | Do users understand the value and rules? | Content, balancing and specialist review |
Regional planning: keep eleven markets in view
Regional averages are useful for orientation, but an operating plan needs country, device and audience detail. Newzoo’s global player forecasts cover all gaming platforms; they should not be relabeled as a mobile-only audience. Apply the same discipline when a regional statistic combines PC, console and mobile.
The table below keeps the eleven markets from this guide’s regional coverage. It replaces unsupported country revenue and growth figures with concrete validation questions for publishers. These are planning checks, rather than claims that every player in a country behaves the same way.
| Market | What to validate before scaling | Useful breakdown |
|---|---|---|
| China | Distribution access, local requirements and product fit | Store, partner and approved release path |
| United States | Acquisition cost against retained value | Channel, operating system and cohort |
| Japan | Localization quality, content expectations and purchase value | Genre, campaign and player lifecycle |
| South Korea | Progression, community and competitive expectations | Audience and live-event participation |
| Türkiye | Local pricing, currency changes and creative fit | Payment behavior and net receipts |
| India | Device coverage, network performance and monetization eligibility | Hardware, language and ad availability |
| Indonesia | Local audience fit and reward economics | Device, channel and revenue method |
| Vietnam | Distribution, localization and production partnerships | Store, audience and partner capability |
| Thailand | Creative, payment and content fit | Campaign, genre and retention cohort |
| Saudi Arabia | Language, content suitability and release requirements | Audience, platform and local support |
| Mexico | Spanish localization and acquisition economics | Channel, device and purchase behavior |
Asia-Pacific requires country-level decisions
China, Japan and South Korea should not share one undifferentiated launch assumption with India, Indonesia, Vietnam and Thailand. Your distribution route, device mix, language work and commercial design need to be specified for each market you intend to serve.
Build a country scorecard with the cost of localization and support beside projected receipts. Test the actual experience on representative devices and connections. A game that performs well on the studio’s test phones may have a different retention profile when memory, download size or loading time becomes a constraint.
Review local partners against the work they will perform. Distribution, creative production and co-development are different capabilities. Ask for relevant evidence and a clear operating agreement for the chosen role, rather than treating local presence as sufficient qualification.
Growth markets still need viable unit economics
Türkiye, India, Indonesia, Vietnam, Thailand, Saudi Arabia and Mexico can each merit investigation for different reasons. Avoid turning the broad “emerging market” label into a promise of cheap acquisition or future ad rate growth. Your audience, channel and game determine the commercial outcome.
Use local campaign tests to establish the cost of acquiring a retained user. Track finalized revenue in a consistent reporting currency while preserving the original currency for reconciliation. Payment costs, refunds and exchange movements can change the amount available to fund the next campaign.
For an ad-led game, inspect demand availability by country and format. For a purchase-centered game, inspect purchase completion and the value of localized offers. A low install price provides little benefit when the monetization path does not work for the users being acquired.
North America and Europe: protect the comparison
For the United States and individual European markets, compare acquisition cost with the retained value of the same cohort. A blended global return can conceal a weak campaign in one expensive segment or a strong result in another. Use the detail necessary to make the budget decision.
Europe also requires a country-level view for language, payments and privacy operations. A single regional eCPM cannot represent every audience or consent state. Keep the product configuration and eligible ad requests visible when comparing outcomes.
Choose expansion tests that the team can support. Launching several languages at once can make a weak result difficult to diagnose. A contained country test with clear ownership often produces more useful evidence than a broad release with incomplete localization and fragmented reporting.
Monetization: four revenue paths to model
In-app purchases
Purchases connect revenue with a specific benefit: content, currency, cosmetics, convenience or progression. Model the value players receive and the cost of maintaining it. Payer conversion alone does not explain whether the broader product retains a healthy audience.
Use gross sales and net receipts as separate measures. Account for relevant fees, taxes, refunds and other adjustments in the model used to fund marketing. Avoid assuming one universal store commission applies to every transaction and channel.
In-app advertising
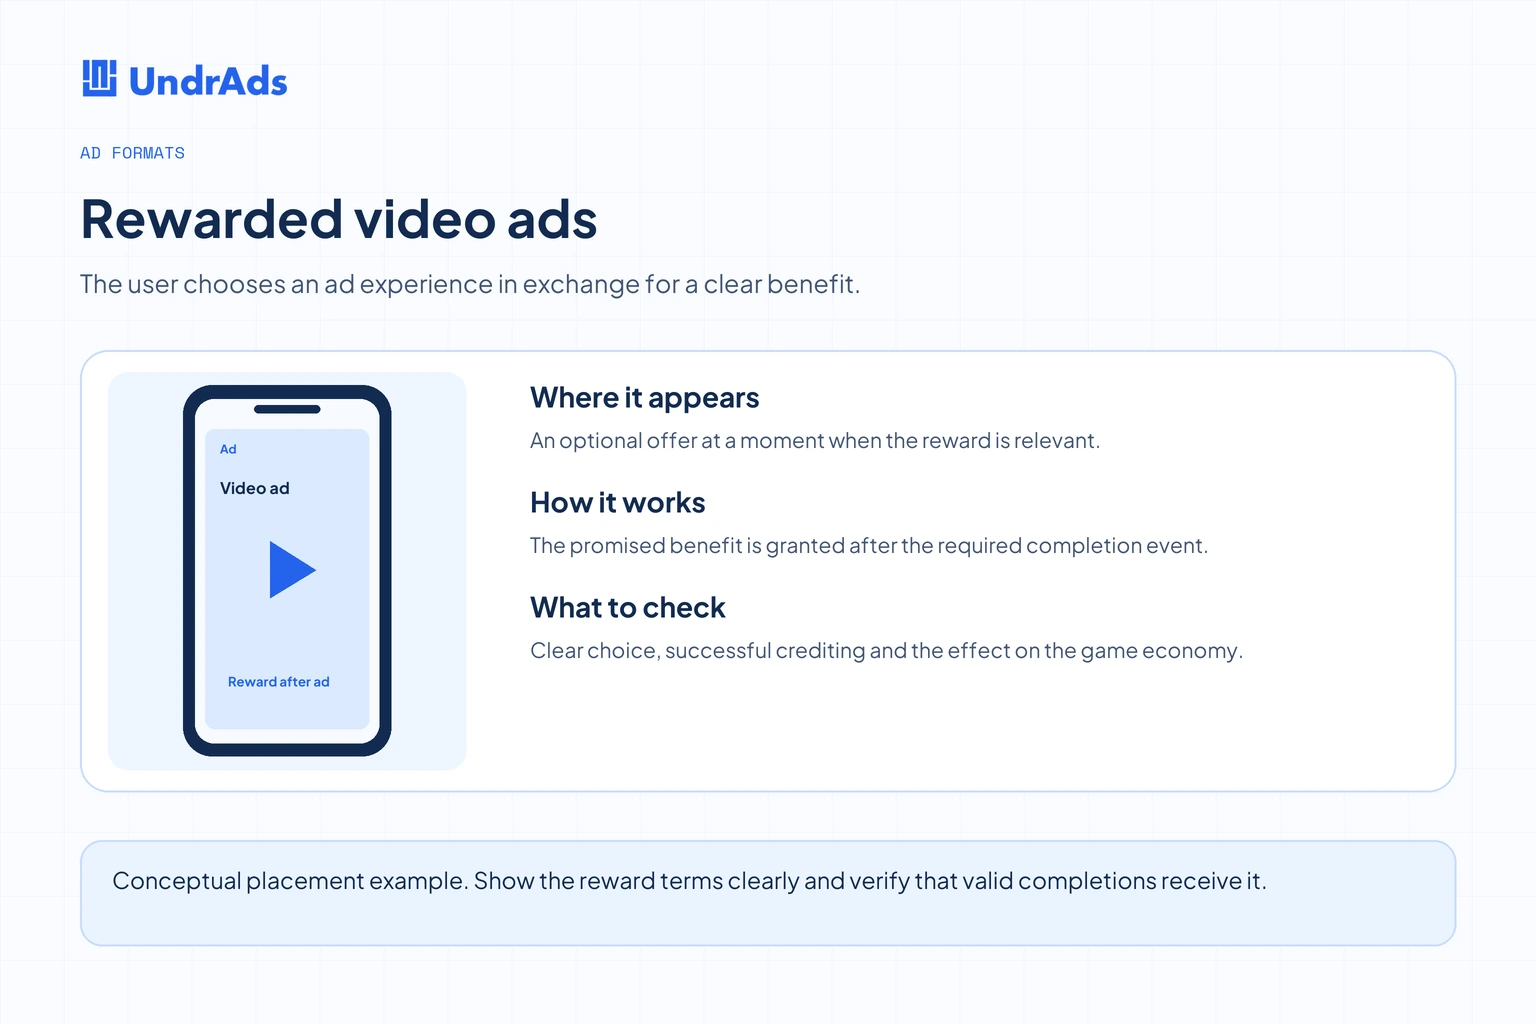
Advertising turns eligible impressions into publisher revenue. Format, placement timing, available demand and technical delivery all influence the result. Start with the player’s journey and identify a moment that can accommodate the experience.
For rewarded ads, explain the exchange clearly and verify delivery of the promised benefit. For interstitials and banners, inspect interruption, layout and return to play. Compare revenue with retention and support outcomes. The useful metric is the game’s overall economics after the change.
Subscriptions and passes
A subscription requires a clear recurring benefit and a workable content or service commitment. A seasonal pass can involve a different payment and renewal structure. Describe the actual offer rather than grouping every pass into recurring subscription revenue.
Model renewal, cancellation, fulfillment and customer support. A successful initial conversion can hide a weak long-term offer if users cancel quickly or the promised content becomes expensive to produce. Keep those operating costs in the planning case.
Hybrid monetization
A game combining purchases and ads needs to measure their interaction. An additional reward can increase engagement, change purchase demand or do both for different players. Test the actual economy rather than applying a fixed industry-wide split between advertising and IAP.
Use total revenue per user alongside its components. Keep the same cohort and observation period across both. That makes it possible to see whether an increase in ad revenue is accompanied by a meaningful change in purchases or retained play.
User acquisition: translate benchmarks into a budget
Adjust’s Gaming App Insights 2026 covers acquisition, engagement and cost metrics across more than twenty gaming subgenres. Newzoo’s 2025 assessment cites Adjust’s global gaming CPI figure of $0.56, up 30% year over year. That historical sample is useful context, rather than a quote for the audience your next campaign will buy.
| Campaign context | Cost check | Revenue window to examine |
|---|---|---|
| Slots | Verify the exact audience, platform and eligibility | Retained value and applicable purchase behavior |
| Idle RPG | Compare creative and channel cohorts separately | Progression, purchases and longer-term engagement |
| Strategy | Include creative and measurement costs | Social retention and later cohort revenue |
| Global benchmark | Check sample, period and weighting | Use for orientation before product-specific tests |
Build a payback view using retained revenue from the users you acquired. Include advertising and purchase income consistently, and distinguish estimated future value from received revenue. A studio with a long payback period also needs enough cash to continue operating while that value arrives.
Evaluate creative on post-install behavior as well as install cost. An inexpensive acquisition can be poor value if the ad attracts users expecting a different game. Keep the creative promise connected with the first session, then measure the journey through the relevant monetization and retention windows.
Five structural shifts to plan for
1. Accessible mechanics are adding deeper systems
Use the growth of hybrid approaches as a product question. Ask which additional progression would make the core game more rewarding over time. Scope that system in stages and measure whether users understand it. Avoid attaching a generic conversion timeline to every studio, since genre, existing code and content capacity differ.
2. Acquisition decisions need retained-value measurement
Rising costs in a benchmark do not explain every campaign’s performance. Inspect creative, auction conditions, attribution and product behavior before assigning a cause. Keep acquisition and monetization teams working from the same cohort definitions so they can agree when to scale or stop spending.
3. Privacy and platform requirements remain operating work
Apple’s privacy guidance explains ATT permission and disclosures for tracking and third-party SDK data use. AdMob’s policy documentation separately covers publisher requirements, placements and rewarded ads. Review current requirements for the actual implementation, and assign ownership for keeping SDK behavior and disclosures aligned.
4. Cloud delivery and connectivity need practical testing
Cloud experiences can change what a device must compute locally, while introducing dependencies on connection quality, latency and service cost. Evaluate those tradeoffs for the intended audience. A large forecast for cloud gaming users cannot establish that a streamed version of your particular game will feel responsive or make economic sense.
5. Regional production partnerships deserve specific evaluation
Studios in markets such as Vietnam and Türkiye can be evaluated as production or publishing partners as well as competitors or audience sources. Define the job, review relevant work and agree on ownership, delivery and communication. Keep talent-market observations separate from unsupported claims about a country’s future revenue or acquisition prices.
What publishers should do with the outlook
If you operate a hypercasual game
Map the early session through to the first delivered ad. Check whether device performance, ad timing or unclear play is limiting retained value. Evaluate a deeper progression layer only after identifying the problem it should solve. Give the team a measurable product hypothesis before committing to a large rebuild.
If advertising is a major revenue source
Review the complete request-to-revenue funnel by country, operating system and format. Verify rewards and ad quality alongside yield. Keep an experiment log so a new bidder, floor rule and frequency change can be assessed separately. Operational clarity helps the team understand why revenue moved.
If you are entering another market
Choose a contained audience and validate localization, technical performance, support and payments before scaling. Include the cost of operating in that market. Use the result to revise the plan rather than treating an industry growth forecast as a commitment to spend.
If you build strategy or RPG titles
Budget for the longer player relationship: content, economy review, community and support. Track purchases within a retained cohort and inspect the experience of users who do not spend. A monetization system needs a product people continue choosing to play.
If ad operations consumes the team’s time
Inventory repeated work across reporting, partner configuration, SDK maintenance and incident response. Decide which tasks can be automated and which require product judgment. Evaluate an operations platform against that inventory with clear success criteria, including the time saved and the quality of decisions made afterward.
A worked planning example
Consider a hypothetical game with 10,000 daily active users. Suppose the average user generates three delivered ad impressions per day, and the blended publisher eCPM is $5. These are illustrative assumptions chosen to explain the calculation, rather than a market benchmark or a forecast for a particular network.
The daily impression total is 30,000. Dividing by 1,000 and multiplying by $5 gives $150 in daily advertising revenue. Ad ARPDAU is therefore $0.015. If the same game also earns $100 in daily purchase revenue on the same accounting basis, combined daily revenue is $250 and combined ARPDAU is $0.025.
Now suppose a placement test increases delivered impressions per user. The short-term advertising total could rise, but the decision still needs retention and purchase data. If users return less often, or if a reward replaces purchases, the higher first-day result may overstate the value of the change.
Conversely, a bidder experiment might increase eCPM while the placement rules stay constant. Compare the actual number of delivered impressions and total revenue, since a higher price on fewer impressions can produce an unexpected result. Keep eligible requests, fills, displays and credited rewards visible throughout the experiment.
This is where market evidence becomes operationally useful. The industry report suggests which questions deserve attention. The game’s own funnel shows which variable needs work. A studio should be able to trace a commercial recommendation back through that chain without relying on a broad claim that every publisher needs more ads or more purchase offers.
The same illustration can show sensitivity. If eCPM rises from $5 to $5.50 while daily users and impressions per user stay constant, advertising revenue rises from $150 to $165. That is a $15 daily increase under the stated assumptions. It does not establish what caused the higher price or whether the result will persist.
If daily active users then fall by 7%, keeping the other new assumptions unchanged, the calculation becomes 9,300 users multiplied by three impressions and $5.50 per thousand. Daily advertising revenue is $153.45. The higher eCPM remains visible, while most of its modeled revenue benefit has been offset by fewer active users.
These figures are a sensitivity example, not a forecast that ads will cause a particular retention change. Their purpose is to show why a publisher should model the important variables together. Use the same approach with purchase conversion, average purchase value, content cost and acquisition spending, while keeping each assumption clearly identified.
Build a forecast the team can revise
Keep assumptions separate from actual results in the planning sheet. Record where each assumption came from and who owns it. A retention target might come from an internal prototype, while a localization budget comes from a production quote. Labeling both as “industry data” would hide their different levels of certainty.
Use the retained user curve to estimate lifetime revenue. A daily revenue average multiplied by an arbitrary number of days can be misleading when the audience changes sharply after installation. Separate new users from established players and compare cohorts at similar ages. Keep the number of users behind each estimate visible.
For acquisition, use an explicit spending limit and a review point. Decide which evidence is sufficient to expand the test, which result requires another iteration and which result stops spending. That plan should be agreed before a strong early dashboard encourages the team to scale beyond what the cohort can support.
Include fixed and variable costs separately. Engineering and a recurring content team behave differently from a campaign budget or a transaction fee. A game can have positive contribution from an acquired user while the studio still needs more revenue to cover its fixed production work.
Allow for reporting delay. Revenue may arrive in one system before another, and estimated advertising earnings can be adjusted later. Freeze a reporting cut-off for each review, then reconcile finalized results when available. Keep the original snapshot so the team can understand why the estimate changed.
Questions for a quarterly market review
Begin each review with the decisions that changed. Did the studio enter a country, change a reward, add a demand partner or release new content? Compare outcomes against the written hypothesis for each change. This keeps the meeting connected with actions the team can actually control.
Then update the external evidence. Replace an older forecast when the source publishes a new assessment, while retaining the earlier version in the record. Do not silently overwrite a historical figure that appeared in a budget approval. The difference between forecast and result is useful information about the planning process.
Review the audience mix before interpreting a blended metric. A larger share of users from another country or device class can move eCPM, CPI and purchase averages even when every segment performs similarly to before. Show segment-level results when they could change the decision.
Finally, inspect the work required to maintain performance. Count recurring reporting effort, unresolved ad incidents, support cases and content commitments. The commercial plan should describe both the revenue opportunity and the people or tools required to operate it. That gives the next quarter’s budget a practical foundation.
Related reading
- 25 mobile gaming publishers and developers by revenue
- Ad formats for mobile gaming apps
- App monetization platforms
- In-app purchases and in-app advertising
- Offerwall ad networks
- Ad operations after 100K DAU
- Adtech glossary
To review how these decisions apply to your game, talk to the UndrAds team with your audience, platforms and current monetization setup.