


eCPM means effective cost per thousand impressions. For publishers, it expresses how much advertising revenue a set of recorded impressions produced for every thousand impressions in that set. It is useful for comparing monetization within a consistent reporting scope.
For 2027 planning, the arithmetic stays simple. The difficult part is choosing comparable data. A rewarded placement in one country and a banner placement across an entire global audience answer different questions, even if their dashboards both display eCPM.
How to calculate eCPM
eCPM = revenue ÷ recorded ad impressions × 1,000. Use revenue and impressions from the same period, placement, currency and reporting source. If there are no impressions, the calculation is undefined; report insufficient data instead of inventing a meaningful rate.
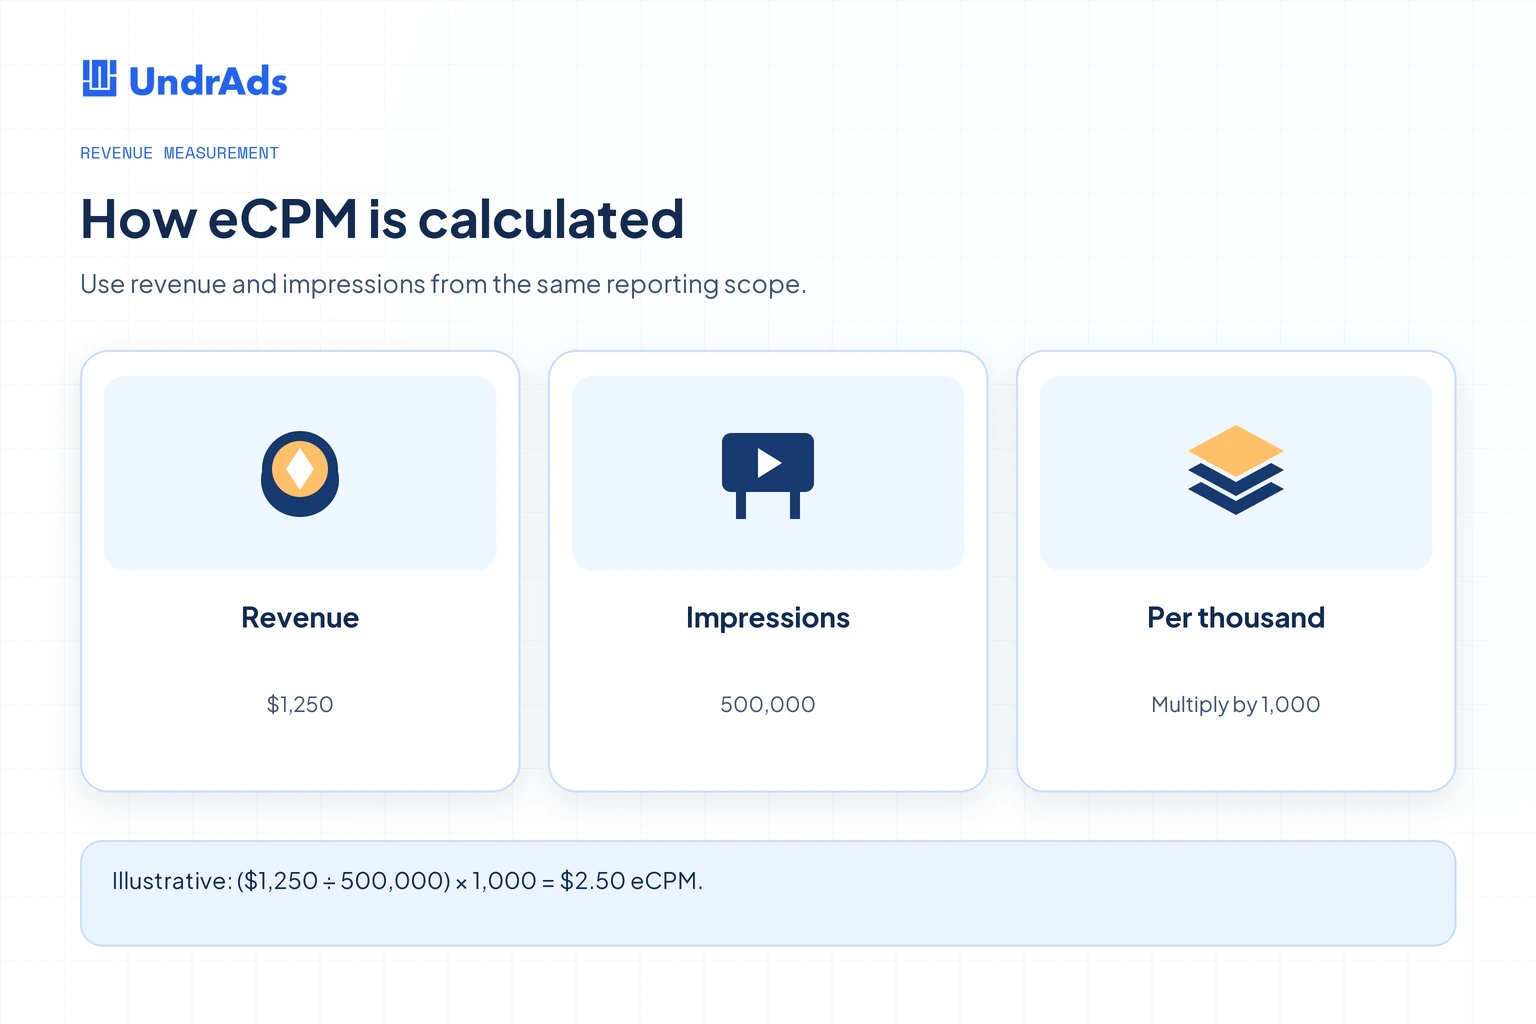
Here is an illustrative example, rather than an industry benchmark. A placement earns $1,250 from 500,000 impressions. Dividing $1,250 by 500,000 and multiplying by 1,000 produces an eCPM of $2.50. If the revenue figure is estimated, the resulting eCPM is estimated too.
Google’s AdMob reports glossary defines its eCPM using estimated earnings and impressions. Check the definition in each platform you use. Reporting systems can differ in how particular events and third-party results are counted.
eCPM, CPM and RPM: what is the difference?
CPM is a price per thousand impressions in a buying or selling arrangement. An advertiser can bid on a CPM basis, while a publisher’s realized eCPM summarizes the revenue actually reported across delivered impressions. These values need not be equal because auction outcomes, reporting scope and commercial arrangements differ.
RPM means revenue per thousand units. The denominator must be named. Impression RPM may describe the same type of calculation as impression eCPM, while page RPM uses page views. Request RPM uses ad requests. Comparing these rates without their denominators creates a false performance story.
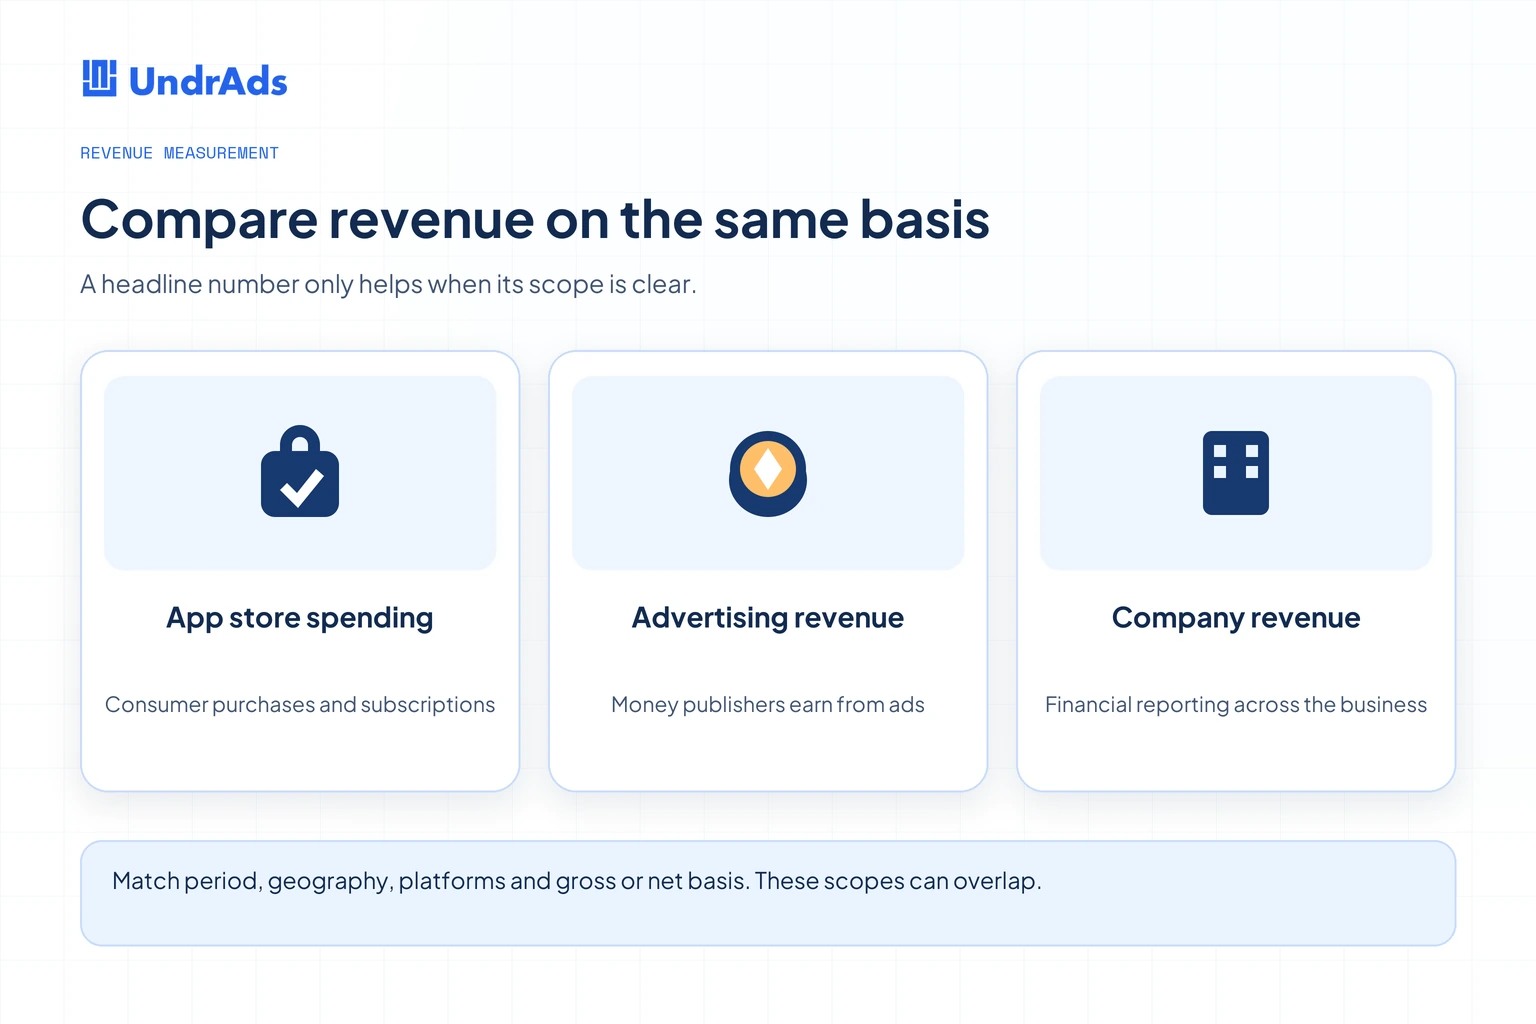
Also distinguish gross and net revenue. Do not assume that a figure labelled eCPM always excludes every fee or equals the amount deposited in the bank. Record the dashboard’s basis, contractual deductions and any later adjustments. Advertising revenue is separate from app-store spending and company-wide revenue.
What is a good eCPM for mobile apps?
A useful benchmark matches the placement you operate. Prefer recent observations with a disclosed country mix, OS, format, sample and period. An unexplained dollar range can conceal more than it tells you. The six-format checklist below replaces universal price promises with the conditions needed for a fair comparison.
| App format | What a useful benchmark must specify | Companion measure |
|---|---|---|
| Offerwall | Whether the denominator is impressions, offers opened or completed actions; reward and payout timing | Revenue per participating user and support cases |
| Rewarded video | Country, OS, placement, completion rules and ad duration mix | Reward success and revenue per eligible user |
| Interstitial | Trigger, frequency and country mix | Revenue per user and post-ad exits |
| Native | Ad presentation, impression measurement and placement | Viewability where measured and accidental-click signals |
| MREC | Supported rectangle size, on-screen context and demand source | Revenue per session and layout impact |
| Banner | Adaptive or fixed size, refresh behavior and position | Total revenue and usable screen space |
An offerwall especially needs a measurement check: a task-based revenue report cannot automatically be compared with a video impression report. Ask the provider exactly what creates the denominator and when revenue is recognized. Keep delayed task approvals separate from immediate ad impressions.
What is a good eCPM for websites?
Website comparisons need their own scope. Device mix, consent status, viewability, traffic sources, ad density and inventory quality can change the result. Keep these six placement categories separate before interpreting a blended rate.
| Web placement | Comparison requirement | What else to inspect |
|---|---|---|
| Video | Player context, placement classification and measurement basis | Starts, completed views and page performance |
| Sticky display | Device, screen coverage and implemented behavior | Viewability, user complaints and policy fit |
| Native | Format, disclosure and content context | Engagement quality and advertiser relevance |
| Leaderboard | Dimensions, device and position | Recorded impressions and layout shifts |
| MREC | Rectangle placement and content depth | Viewability and revenue per page |
| Below-the-fold display | Scroll depth, loading rules and impression counting | Request-to-impression behavior and page speed |
A web publisher can improve page revenue while impression eCPM stays flat if more suitable inventory is seen. The reverse is also possible: removing many low-priced impressions can raise average eCPM while reducing total revenue. Read the rate alongside its volume.
Nine factors that affect eCPM
- Geography. Advertiser demand differs between markets. Segment countries before diagnosing a change in your blended average.
- Operating system and device. Platform rules, audience composition and device capabilities can affect eligible demand. Avoid applying a fixed iOS premium to every app.
- Ad format and placement. A full-screen optional placement and a small persistent banner offer different experiences and inventory.
- Seasonality. Campaign budgets and user behavior vary over time. Compare similar periods and avoid treating a seasonal high as a permanent baseline.
- Audience and acquisition mix. New campaigns can change country, behavior and payer composition. A mix shift may explain an apparent monetization decline.
- Demand competition. Eligible bidders and waterfall sources influence auction outcomes. More integrations do not guarantee more revenue.
- Technical delivery. Load failures, latency, expired ads and missed show opportunities can change which impressions reach the report.
- Privacy and eligibility. Consent choices, age treatment and applicable restrictions affect available advertising paths. Follow the required choices without manipulating them for price.
- Floor and auction configuration. A higher minimum price can reject demand. Evaluate lost volume alongside the price of impressions that remain.
Use weighted eCPM when combining results
Average the underlying revenue and impressions, rather than taking a simple average of rates. Consider two illustrative cohorts: 100,000 impressions earn $1,000, while 900,000 earn $900. Their individual eCPMs are $10 and $1.
The combined result is $1,900 divided by 1,000,000 impressions, multiplied by 1,000: $1.90. Averaging $10 and $1 would produce $5.50, which overweights the smaller cohort and misstates actual performance.
Store both the rate and its underlying counts in reporting exports. That makes it possible to recompute portfolio totals correctly, investigate discrepancies and distinguish a pricing change from a change in country or format mix.
How to improve app eCPM without losing the business result
Begin with reliable delivery. Check supported SDK and adapter combinations, loading behavior, placement triggers and reward callbacks. Separate a failure to obtain an ad from an ad that loaded but was never displayed. Price optimization cannot repair a broken show path.
Then test demand and configuration with a controlled comparison. Google’s floor guidance notes the trade-off between minimum prices and fill. Check the demand paths a setting controls before changing it. Compare revenue per active user, impression volume and retention as well as eCPM.
Review frequency and reward value with the product team. More ads can increase immediate revenue and still damage longer-term engagement. Keep purchases in the analysis when rewarded currency or item grants could alter spending behavior. Define acceptable changes before a test begins.
How to improve website monetization
Inspect placement visibility, layout stability and loading behavior before adding ad density. A unit that disrupts reading or delays useful content can harm the audience you depend on. Use actual page and device measurements rather than assuming a larger unit always performs better.
Compare suitable demand partners with the same inventory scope. Review revenue per page and per session alongside impression eCPM. Track consent implementation, traffic quality and policy notices so an apparent pricing problem does not conceal an eligibility or delivery issue.
Common mistakes when reading eCPM
- Comparing different countries, formats or reporting periods as though they were identical.
- Mixing estimated revenue with finalized payments or gross revenue with net proceeds.
- Averaging rates without weighting by impressions.
- Calling request RPM, page RPM and impression eCPM the same metric.
- Raising floors and celebrating a higher rate while ignoring lost revenue.
- Using a small sample or partial day to claim a durable improvement.
- Assuming every movement came from mediation when acquisition or audience mix changed.
A practical diagnostic example
Suppose a placement’s eCPM rises from $5 to $6 while daily impressions fall from 100,000 to 70,000. These are illustrative figures. Revenue moves from $500 to $420 despite the higher rate. Before keeping the change, investigate whether the loss came from stricter floors, fewer eligible users, an ad-loading problem or a different traffic mix.
Now suppose active users also fell. Revenue per user may tell a different story from total revenue, but that still does not establish why users declined. Compare the timing with acquisition changes, crashes and retention. A monetization decision needs an explanation consistent with the underlying counts.
Write down the hypothesis before making another change. For example, test whether a lower floor restores profitable volume in one defined placement without changing frequency. Keep the comparison period and audience suitable, record uncertainty and retain a rollback path. This produces a decision your team can review instead of a dashboard number that looks better without improving the business.
How UndrAds can help
UndrAds supports studios with monetization analysis and operations. A useful review connects pricing, delivery, demand and user outcomes in one measurement plan. Start with your current baseline and an agreed business objective, then test changes against that objective. Any claimed improvement should specify the app, cohorts, period and revenue basis.